Disclaimer: The concepts discussed in this article are for educational purposes only. Trade with Ani is not SEBI registered. Financial markets carry a high level of risk, and past performance is not indicative of future results.
Introduction: The Missing Puzzle Piece in Price Action Many traders obsess solely over price action—the shape of Japanese candlesticks or the geometry of chart patterns. While price is crucial, it only tells half the story. The other half is volume. Price tells you what happened, but volume tells you why it happened and, more importantly, how much conviction is behind the move.
Volume Spread Analysis (VSA) is a methodology created by Tom Williams (building upon the original work of Richard Wyckoff) that analyzes the relationship between volume, the spread of the price bar (high minus low), and the closing price. By mastering VSA, you can spot institutional accumulation (buying quietly) and distribution (selling quietly) long before a major breakout or breakdown occurs.
The Core Principle of VSA: Effort vs. Result The foundational rule of Volume Spread Analysis is that effort (volume) must equal result (price spread). When this equilibrium breaks down, it signals that “Smart Money” is intervening.
- Harmony (Trend Confirmation): A large bullish candle closing near its high on massive volume indicates harmony. Heavy buying effort resulted in a massive upward price movement. The trend is validated.
- Anomaly (Smart Money Intervention): A large bullish candle closing near its high on very low volume indicates a lack of supply—the market is drifting up, not being pushed. Conversely, a massive volume spike with a very small, doji-like price spread indicates that massive institutional selling is absorbing all retail buying. This is a critical warning sign of an impending reversal.
Key VSA Signals to Identify Institutional Footprints
To trade alongside institutions, you must recognize these specific VSA footprints on your charts:
1. The “Stopping Volume” (Accumulation) This occurs at the end of a long downtrend. Retail traders are panicking and selling heavily. Suddenly, you see a massive spike in volume, but the bearish candle spread is very small, and it closes in the middle or near the top.
- The Logic: If that massive volume was purely selling, the price should have plummeted further. The fact that the price barely moved downward means institutions have placed massive passive buy limit orders, absorbing all the panic selling. This marks the bottom.
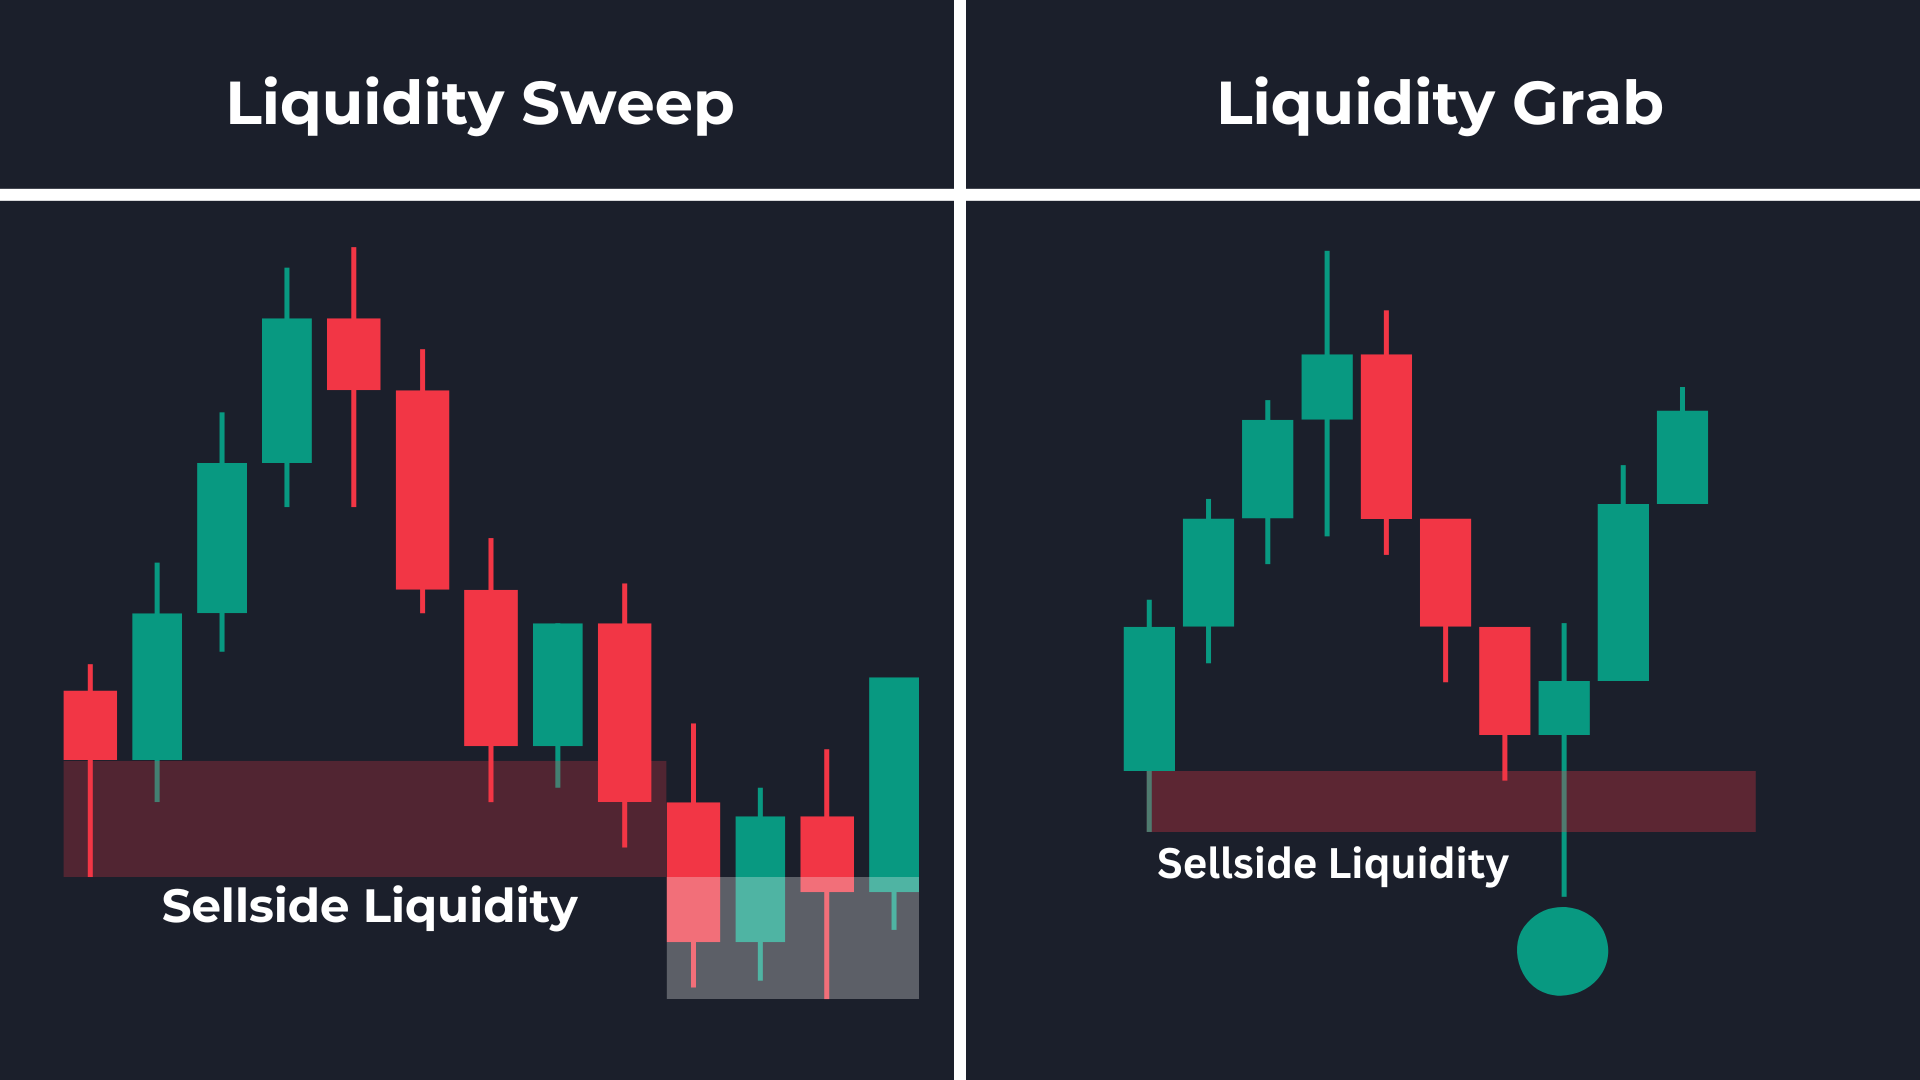
2. The “Upthrust” (Distribution/Fakeout) An Upthrust is the VSA equivalent of a liquidity sweep. The price breaks out above a major resistance level, often trapping retail breakout traders. However, the volume is ultra-high, and the candle closes back near its low, forming a bearish pin bar.
- The Logic: The high volume was generated by retail traders buying the breakout. The Smart Money used that liquidity to sell massive short positions into the buying frenzy, driving the price back down. This is a high-probability shorting opportunity.
3. “No Demand” and “No Supply” Bars These are critical continuation signals used to enter trades safely after an institutional move has begun.
- No Demand: During a downtrend, the price rallies slightly (a retracement) on very low volume, closing in the lower half of the candle. This indicates that institutions have zero interest in buying higher prices. The downtrend is safe to join.
- No Supply: During an uptrend, the price dips slightly on very low volume, closing in the upper half. Institutions are not selling; they are just letting retail traders take minor profits before the next leg up.
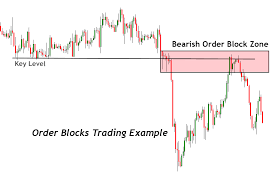
Integrating VSA with Market Structure VSA is not a standalone strategy; it is an amplifier for structural analysis. If you identify a bullish Order Block (OB) or Fair Value Gap (FVG) on a higher timeframe, you wait for the price to retrace into that zone.
Instead of buying blindly, you look for VSA confirmation. If the price approaches the OB on decreasing volume (No Supply) and then produces a “Stopping Volume” candle directly inside the OB, your probability of a successful trade skyrockets. You have aligned structural logic with institutional volume confirmation.
Conclusion Ignoring volume is like trying to drive a car while only looking at the speedometer and ignoring the fuel gauge. Price tells you the speed, but volume tells you if there is enough fuel to sustain the move. By incorporating Volume Spread Analysis, you shift from reacting to lagging indicators to reading the live, underlying mechanics of supply and demand.
Author: Ani (Founder, Trade with Ani) – Specialist in Advanced Price Action and Market Dynamics.