Disclaimer: The concepts discussed in this article are for educational purposes only. Trade with Ani is not SEBI registered. Financial markets carry a high level of risk, and past performance is not indicative of future results.
Introduction: Escaping the Retail Trading Trap Most retail traders are introduced to the financial markets through basic technical analysis: support and resistance lines, trendlines, and conventional chart patterns like double tops or head and shoulders. While these concepts provide a foundational understanding of market geometry, they often fail in live market conditions. The reason is simple: institutional algorithms and large liquidity providers know exactly where retail traders place their stop losses based on these basic patterns.
To achieve consistent profitability and trade like a professional, you must graduate from retail concepts and understand how the “smart money” operates. This involves mastering Institutional Order Flow, identifying true areas of supply and demand, and recognizing liquidity sweeps. This comprehensive guide will break down advanced price action strategies that allow you to track institutional footprints and trade alongside major market movers rather than against them.
Understanding Institutional Order Flow Institutional Order Flow refers to the footprint left by large financial entities—such as hedge funds, central banks, and major banks—when they execute massive block orders in the market. These entities cannot enter or exit their positions all at once without causing massive slippage and destroying their own entry prices. Therefore, they break their orders down and accumulate or distribute positions at specific price levels over time.
Retail traders look for a line on a chart; institutional traders look for liquidity. Order flow trading is the process of reading the chart to determine where these large orders are positioned. When you understand order flow, you stop looking at the market as a series of random wiggles and start seeing it as a structured mechanism designed to deliver price from one pool of liquidity to another.
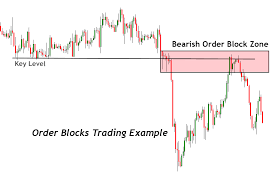
The Anatomy of an Order Block (OB) An Order Block (OB) is a specific price range where institutional buying or selling originated. It is often the last opposing candle before a strong, impulsive move that breaks market structure.
- Bullish Order Block: The last bearish (down) candle before a strong bullish impulse that breaks resistance or market structure to the upside. Institutions accumulated long positions here.
- Bearish Order Block: The last bullish (up) candle before a strong bearish drop that breaks support or market structure to the downside. Institutions accumulated short positions here.
How to Trade Order Blocks:
- Identify the Break of Structure (BOS): An order block is only valid if the subsequent move breaks a significant structural high or low. If there is no BOS, it is not a valid OB.
- Wait for the Retracement: Once the impulsive move happens, wait for the price to retrace back to the order block. Do not chase the initial breakout.
- Entry and Invalidations: Enter when the price taps into the order block (often the 50% level of the OB candle). Your stop loss goes just beyond the extreme of the order block candle. If the price closes significantly beyond the OB, the setup is invalidated.
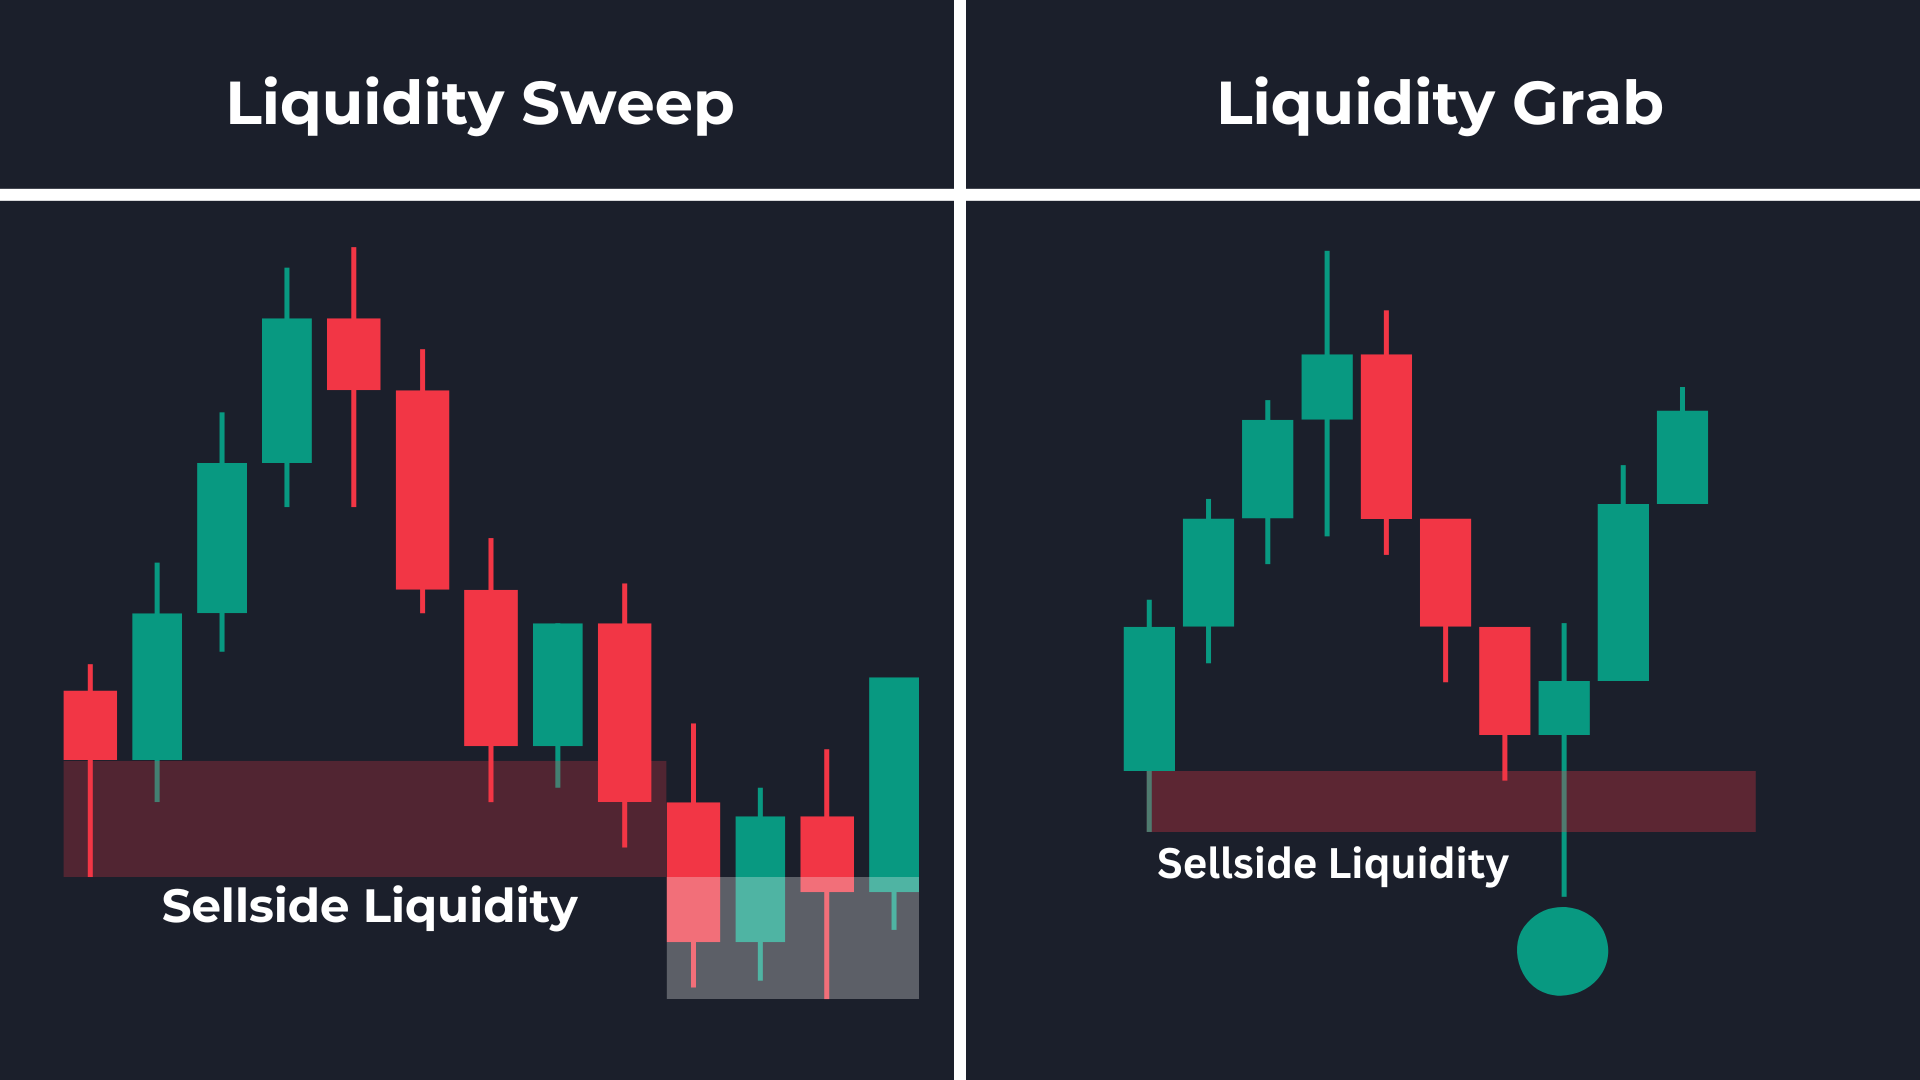
Liquidity Sweeps vs. Retail Breakouts One of the most frustrating experiences for a retail trader is the “fakeout.” You see a clear resistance level, price breaks above it, you buy the breakout, and immediately the market reverses and hits your stop loss. This is not bad luck; it is a engineered liquidity sweep.
Where does liquidity rest?
- Above equal highs (Retail buy stops and breakout buyers).
- Below equal lows (Retail sell stops and breakdown sellers).
- Above old daily/weekly highs and below old daily/weekly lows.
Institutions need massive liquidity to fill their orders. If they want to sell a massive block of shares, they need willing buyers. By pushing the price just above a major resistance level, they trigger the buy-stop orders of breakout traders and the stop-loss orders of early short sellers. This creates a flood of buy orders, which the institutions happily sell into. Once their sell orders are filled, they drive the price back down.
The Strategy: Instead of trading the breakout, trade the sweep. Wait for the price to pierce a major high or low, fail to sustain momentum, and aggressively reverse back into the previous range. Enter on the reversal, targeting the liquidity pool on the opposite side of the range.
Fair Value Gaps (FVG) and Market Imbalances A Fair Value Gap (FVG), also known as an imbalance, occurs when the market moves so violently in one direction that there is an unequal delivery of price. In a healthy market, buying and selling are relatively balanced. During an impulsive institutional move, there is a lack of opposing liquidity, leaving a “gap” in the price action.
Visually, a FVG is identified using a three-candle sequence:
- Candle 1: The starting candle of the move.
- Candle 2: The large impulsive candle (the imbalance).
- Candle 3: The candle following the impulse.
The FVG is the space between the high of Candle 1 and the low of Candle 3 (in a bullish scenario). The market treats these gaps like magnets. Because price was delivered inefficiently during that explosive move, the market will eventually return to that zone to offer fair value to the opposing side before continuing its primary trend. Entering trades upon the mitigation (filling) of an FVG is a high-probability strategy.
The Multi-Timeframe Matrix (Top-Down Analysis) Advanced trading requires viewing the market through a multi-timeframe lens. Trading a 5-minute order block without knowing the daily trend is a recipe for disaster.
- Macro Direction (Daily/Weekly Chart): Identify the overarching institutional order flow. Are we making higher highs and higher lows? Where are the major liquidity pools?
- Execution Timeframe (1H/15m Chart): Look for your specific setups—Order Blocks, FVGs, or Liquidity Sweeps—that align with the macro direction. If the daily chart is bullish, you should only be looking for bullish FVGs and bullish order blocks on the 15-minute chart.
- Refinement (5m/1m Chart): Use lower timeframes strictly to refine your entry point within the higher timeframe point of interest (POI) to minimize your stop loss and maximize your risk-to-reward ratio.
Strict Risk Management Framework No advanced strategy will save a trader with poor risk management. Institutional strategies offer high risk-to-reward ratios (often 1:3, 1:5, or higher), which means you do not need a high win rate to be extremely profitable.
- Never risk more than 1% to 2% of your total capital on a single trade.
- Always calculate your position size based on the pip/point distance from your entry to your stop loss.
- Do not move your stop loss wider once the trade is active. If the trade thesis is invalidated, accept the small loss and wait for the next high-probability setup.
Conclusion Transitioning from a retail mindset to an institutional perspective takes time, patience, and rigorous backtesting. By removing the clutter of lagging indicators and focusing purely on price action, liquidity, and order flow, you align yourself with the true drivers of the market. Stop looking for lines to hold; start looking for where the money is trapped, and trade the manipulation.
Author: Ani (Founder, Trade with Ani) – Specialist in Advanced Price Action and Market Dynamics.